Mapping Abundance in Streams in R

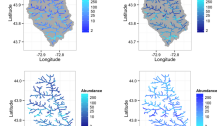
I haven’t worked with raster or spatial polygon data in R much before, but I want to create maps to show the results of a spatiotemporal model. Specifically, I want to depict the changes in abundance of fish in a stream network over time and space. I decided to play around with various packages for…

New Paper: Modeling Daily Stream Temperature

Our paper, “A hierarchical model of daily stream temperature using air-water temperature synchronization, autocorrelation, and time lags” was just published today in the journal PeerJ. We developed a statistical model of daily stream temperature for a watershed in Western Massachusetts, USA. We outline the major challenges of statistical stream modeling and show how our model…